

Tag: Tencent
Trading Opportunity for China Internet and China EV.
Hong Kong market is bad. Hang Seng Index is below 18,800 and people are now saying maybe we test the 14597.31 low in Oct 2022. I recall Oct 2022 low was printed with:
1) fear of Mainland-Taiwan tension
2) President Xi announcing his new leadership team in Communist Party Congress
3) high inflation in US and Europe and US FED rate hikes
4) a cold winter with no gas in Europe
None of the above became a real issue and today, we are worry again(?):
a) US stock market correction. US S&P has been above 4,000 year-to-date despite Morgan Stanley US equity strategist Michael Wilson kept saying S&P could fall to 3,000.
https://www.cbsnews.com/news/morgan-stanley-stock-outlook-20-percent-drop/
b) Europe stock market correction. Eurostoxx 50 is up 16% in one year. N225 is up 15% in one year. EUR has strengthened against USD year to date and currently at 1.07 vs last year Sep low of 0.96. JPY has weakened from 128/130 to 140.
c) US Fed rate is at 5-5.25% and CPI is still going up. So rates may stay at this current level. This is a real issue and affects business that is leverage.
d) US Treasury yield curve is inverted and this predicts a recessionary future. 5% rate for 1 year or shorter. 3.7-4.3% for 2-30 years. It is inverted but not that inverted. CME FedWatch tool is implying 28% chance for Fed Rate to be at 3.75-4% in Jul 2024. This could make the yield curve flat. Plus US Treasury is not keen to pay high coupon for their long dated bonds.
https://www.ustreasuryyieldcurve.com/
e) US Debt Ceiling => technical default for a few days?
f) Hang Seng Index is down 7.3% in a year and many ex-HOT stocks testing Oct 2022 low
I would only worry about the last two items.
Short term volatility from (e) Debt Ceiling saga could indeed cause a roller coaster to stocks and bonds market. 3 potential actions:
i) Sell in May and Go Away. Buy back after the debt ceiling is lifted.
ii) Bargain hunt if S&P goes below 4,000
iii) be Warren Buffet and sit tight
Unrealised losses from (f) is really making investors sad. Alibaba, JD and Tencent have been getting cheaper since end of Jan (last rally) and many clients are stuck, running out of bullets to average down. Tencent has been paying special div through JD and Meituan shares to keep shareholders happy. Alibaba spin-off is likely to pay shares to shareholders as well. JD has not got much to pay its shareholders and it is down 42% year to date. Tencent is down 1.7% and Alibaba is down 11% year to date.
What to do? Well, the good news is that Alibaba, Tencent and JD still have a good business and they are profitable. So sit tight is an option.
China EV sector is a “polarised sector”. BYD +16.4% year to date, LI Auto +34.2%, Nio -20%, XPeng -19.5%. We would switch out of Nio and XPeng and buy BYD and LI. EV is a long term trend but not all players can survive. Aston Martin makes really nice cars but you may not want to be their shareholders
CFD Trading 18 July 2019
Capitaland Stock Code C31.SGX
Outlook
Price reached a high of $3.75 on 8th July and has declined lower to $3.64. The decline looks corrective in nature as MACD is still bullish and both lines are above zero. Price is also above the cloud and Base line is showing a bullish trend as price is above it. The decline may not be over yet and we think there could be further decline to support point at $3.57 or the Fibonacci 38% correction point of the rally from $3.17 to the high at $3.75, which comes in at $3.53. This zone is where the Base line is currently at and this adds another level of support. If price is supported at the Fibonacci 38% correction point of $3.53, there is a good chance of a price move to $3.75 or higher.
Strategy
$3.55 Buy
$3.75 Price Target
$3.43 Risk Management Stop
3 weeks Trade Duration

Tencent Holding Limited Stock Code 700.HKE
Outlook
Price broke above the cloud 2 days ago and yesterday, it managed to stay and close above the cloud. Price also managed to close above a down trending line and is currently sitting on this line. Price is currently above both the Conversion line and Base line and above the cloud, which is a sign of a bullish trend in place. If price can stay above the support at $359.20, it can go higher to $381. MACD is bullish and above the zero line. Both lines of MACD are also rising and its histogram is green and rising as well.
Strategy
HK362.50 Buy
HK381.00 Price Target
HK349.30 Risk Management Stop
3 weeks Trade Duration

Related Posts
CFD Trading 7 March 2019
Singapore Exchange Stock code S68.SGX
Outlook
Price reached a bottom on the 30th of Oct at $6.52 and had advanced to a high of $8.05 on the 5th of Mar 2019. There was an Inverse Head and Shoulder chart pattern and its target was close to the recent price high. The rally since late Oct could be ending. There was a Hanging Man candlestick pattern 2 days ago that was followed by a big red candle the next day. Hanging Man is a reversal pattern. MACD has been showing weaker movement while price rallied. There was also a bearish divergence warning given by MACD. We think the price rally has probably ended. We think price is likely to decline to $7.52, which is the Fibonacci 50% correction point of the rally from $7.00 to $8.05.
Strategy
$7.92 Short Sell
$7.52 Price Target
$8.06 Risk Management Stop
2 weeks Trade Duration

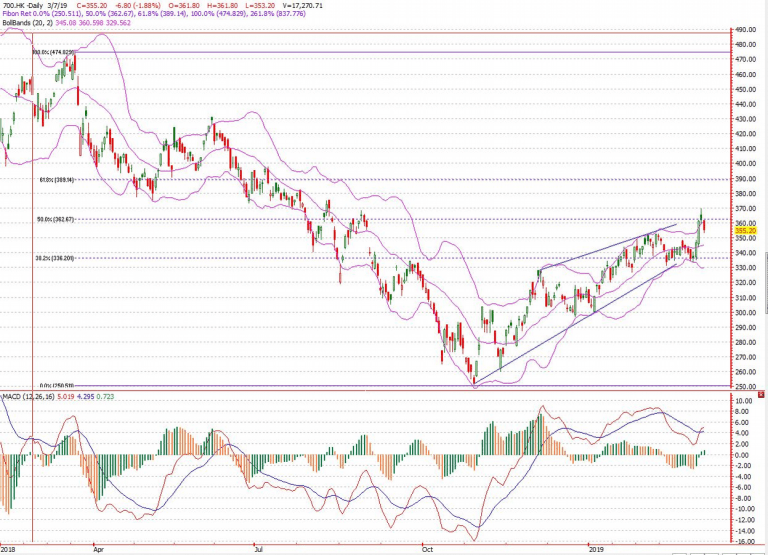
Tencent Stock Code 700.HKE
Outlook
Price reached a bottom on 30th Oct 2018 at HK251.40. Since the low, a rally brought price to HK370 on 6th Mar 2019. The high of HK370 was just above the Fibonacci 50% of the decline from HK475.60 in Mar 2018 to Oct 2018 low of HK251.40. It was also below the key resistance of HK388.80. This could be a sign that the recent rally has ended. The day after the high was a big red candle that was almost twice the size of the previous day. MACD is showing bearish divergence warning of a possible top in the making.
Strategy
HK355.00 Short Sell
HK320.00 Price Target
HK371.00 Risk Management Stop
2 weeks Trade Duration
Related Posts
CFD Trading 15 February 2019
Tencent Stock code 0700.HKE
Outlook
Price reached a high of HK352.80, which is the Fibonacci 127% of the previous rally from 251.10 to 328.20. This could mark the end of the corrective rally from the low of HK251.10. Price also failed to move above the Fibonacci 62% of the previous decline from HK430.70 to HK251.10. There were divergence warnings from MACD, hinting of a possible price top. There was a price gap which price failed to fill as well. Price was unable to move above gap resistance at HK354.70. Failure to close the gap means the bearish trend has not changed. We think the corrective rally could be over and price could be about to turn down to HK330 again
Strategy
HK349.00 Short Sell
HK330.00 Price Target
HK355.20 Risk Management Stop
2 weeks Trade Duration

Genting Singapore Stock Code G13.SGX
Outlook
Price may have reached a high at $1.12. It has touched this price on 4 occasions but did not manage to one close at this price. There is a resistance just above at $1.13 as well. MACD showed a bearish divergence, warning of a possible price high. Price was also capped by the Bollinger Band’s upper band. The Bollinger Band is also narrowing, which is a sign of lower volatility. This is a sign of price reaching a high and starting to consolidate. This adds weight to the theory that price has reached a high.
Strategy
$1.10 Short Sell
$1.02 Price Target
$1.15 Risk Management Stop
2 weeks Trade Duration
