Singapore Exchange Stock code S68.SGX
Outlook
Price reached a bottom on the 30th of Oct at $6.52 and had advanced to a high of $8.05 on the 5th of Mar 2019. There was an Inverse Head and Shoulder chart pattern and its target was close to the recent price high. The rally since late Oct could be ending. There was a Hanging Man candlestick pattern 2 days ago that was followed by a big red candle the next day. Hanging Man is a reversal pattern. MACD has been showing weaker movement while price rallied. There was also a bearish divergence warning given by MACD. We think the price rally has probably ended. We think price is likely to decline to $7.52, which is the Fibonacci 50% correction point of the rally from $7.00 to $8.05.
Strategy
$7.92 Short Sell
$7.52 Price Target
$8.06 Risk Management Stop
2 weeks Trade Duration

Tencent Stock Code 700.HKE
Outlook
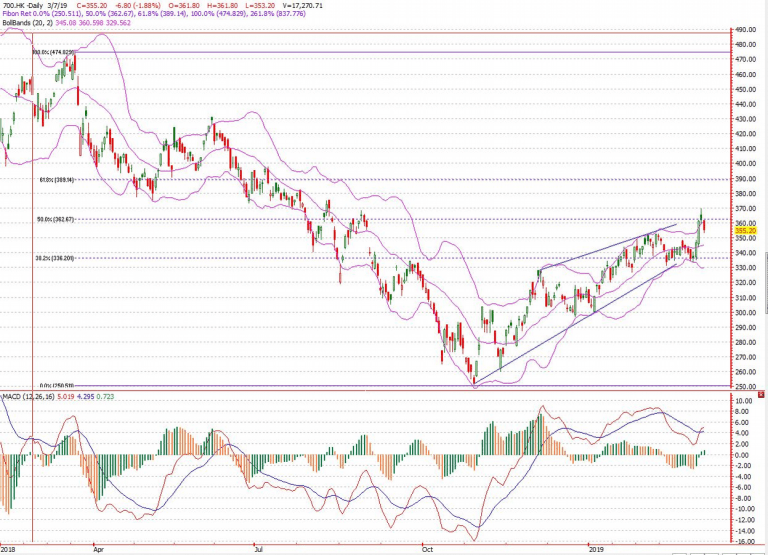
Price reached a bottom on 30th Oct 2018 at HK251.40. Since the low, a rally brought price to HK370 on 6th Mar 2019. The high of HK370 was just above the Fibonacci 50% of the decline from HK475.60 in Mar 2018 to Oct 2018 low of HK251.40. It was also below the key resistance of HK388.80. This could be a sign that the recent rally has ended. The day after the high was a big red candle that was almost twice the size of the previous day. MACD is showing bearish divergence warning of a possible top in the making.
Strategy
HK355.00 Short Sell
HK320.00 Price Target
HK371.00 Risk Management Stop
2 weeks Trade Duration