
Market News
- Wall Street’s headache over the potential of a relatively fast pullback from stimulus and quick rate hikes by the U.S. Federal Reserve lingered on Thursday as stocks sold off again and government bond yields mostly marched higher.
- The Dow Jones Industrial Average fell 170.64 points, or 0.47%, to 36,236.47, while the S&P 500 index lost 4.53 points, or 0.10%, to 4,696.05. The Nasdaq Composite index dropped 19.31 points, or 0.13%, to 15,080.87.
- Benchmark 10-year yields rose to 1.7530%, the highest since March 2021, and were last up slightly on the day to 1.7246%. U.S. 2-year yields, which track near-term rate expectations, rose to the highest since early March 2020. At the start of the global spread of COVID-19, the 2-year yield was at 0.8736%.
Market Views
- Asian shares snapped two days of losses on Friday, climbing as investors waited to see whether U.S. jobs data due later in the day would reinforce the need for faster U.S. interest rate hikes. The Nikkei 225 index was down 55 point while the Hang Seng was up 287 points.
- Oil prices rallied, which some analysts linked to news that Russian paratroopers had arrived to quell unrest in Kazakhstan, though production in the OPEC+ producer country remains largely unaffected so far. Further unrest could cause oil price to rise adding to inflation woes.
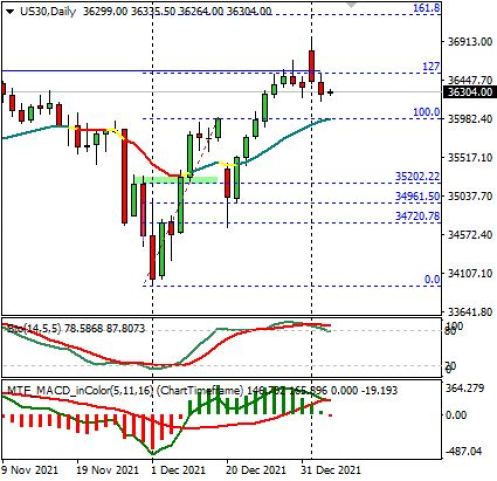
Dow Jones Index
(CFD Symbol: US30)
Trend :
Recommendation : Long @ 36,500
Last : 36,304
Target price: 37,200
Protective stop: 36,150
Outlook
This index broke above the previous high at 36,565 and as long as this index can stay above at 35,982, we are likely to test the Fibonacci 161.8% price projection target at 37,250. MACD remains bullish and is hinting at a bullish price trend but Stochastic is in the overbought zone, hinting at a limited upside. 20EMA is hinting of a bullish price trend
Trading Idea
Buy 36,500 for 37,200 with a stop below 36,150. Entry was filled on 5 Jan.
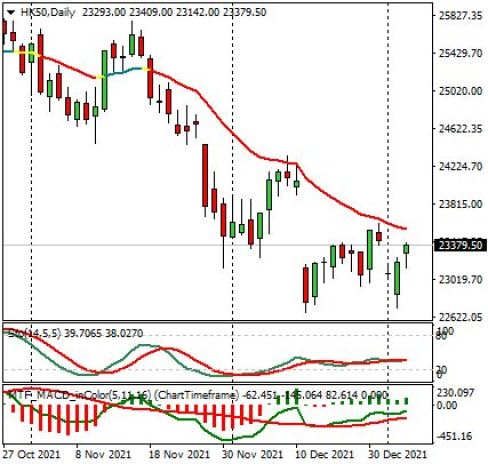
Hang Seng Index
(CFD Symbol: HK50)
Trend :
Recommendation :
Last : 23,379
Target price:
Protective stop:
Outlook
This index managed to bounce up near to the previous low but the rally is likely to face resistance from the 20EMA. This index will need to move above the 20EMA to confirm a bottom and a rally to 24,450. MACD had warned with a divergence of a potential price low and Stochastic is near to the oversold zone, hinting at a possible price rally.
Trading Idea
Wait for better trading idea
Nasdaq 100 Index
(CFD Symbol: USTEC)
Trend :
Recommendation :
Last : 15,775
Target price :
Protective stop:
Outlook
This index failed to move above its previous high and has fallen below its 20EMA, triggering the fall to current level. Price has reached close to the Fibonacci 50% correction point at 15,773. Stochastic is still moving lower but MACD remains bullish. 20EMA is bearish.
Trading Idea
Wait for better trading idea.

S&P 500 Index
(CFD Symbol: US500)
Trend:
Recommendation:
Last: 4707
Target price:
Protective stop:
Outlook
This index has reached the 20EMA and if it can hold above the 20EMA, we could see a rally to test the previous high again. A Doji at the 20EMA supports this view. MACD is also supporting this bullish view but Stochastic is hinting at a price decline.
Trading Idea
Buy 4700 for 4780 with a stop below 4665
