
Market News
- The S&P 500 and Nasdaq ended lower on Tuesday after hitting record highs earlier in the session, with investors digesting a jump in consumer prices in June and earnings from JP Morgan and Goldman Sachs that kicked off the quarterly reporting season.
- June-quarter earnings per share for S&P 500 companies are expected to rise 66%, according to Refinitiv data, with investors questioning how long Wall Street’s rally would last after a 16% rise in the benchmark index so far this year.
- All eyes now turn to Fed Chair Jerome Powell’s congressional testimony on Wednesday and Thursday for his comments about rising price pressures and monetary support going forward.
Market Views
- Asia Pacific stocks were mostly down on Wednesday morning, after their U.S. counterparts also fell from record highs, over a surprise jump in U.S. inflation. Hang Seng index fell 173 points and Nikkei 225 index slid 59 points.
- U.S.-China tensions are rising as U.S. President Joe Biden nominated Alan Estevez to lead the Bureau of Industry and Security that oversees export control and could limit China’s access to technology. The U.S. is also discussing a proposal for a digital trade agreement covering Indo-Pacific economies.
Dow Jones Index
(CFD Symbol: US30)
Trend :
Recommendation :
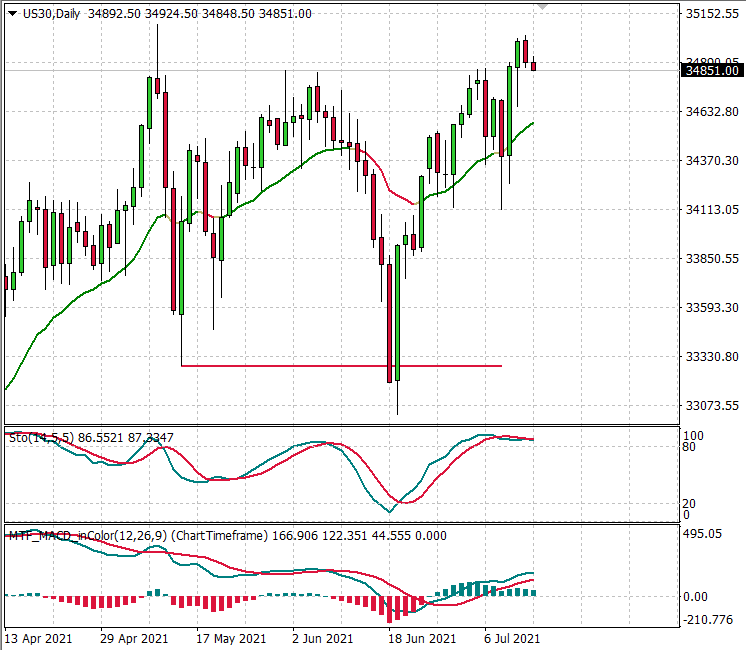
Last : 34,851
Target price:
Protective stop:
Outlook
Price is moving towards its recent high of 35,092. A correction towards the 20EMA support at 34,570 could be likely if price cannot surpass its high. It has to break through its high for more upside ahead. Stochastic is at the overbought region now. MACD has turned bullish.
Trading Idea
Buy 34,600 for 35,080 with a stop below 34,350
Hang Seng Index
(CFD Symbol: HK50)
Trend :
Recommendation :
Last : 27,764
Target price:
Protective stop:
Outlook
This index managed to climb back inside the rectangle consolidation zone that started since March 2021 after violating it on 8 July. Price is going to test its first 20EMA resistance at 28,210. If price able to penetrate above the 20EMA, we are likely to see price testing its upper end of the consolidation zone. Stochastic is rising now but MACD has turned bearish.
Trading Idea
Buy 27,300 for 28,200 with a stop below. 26,820

Nasdaq 100 Index
(CFD Symbol: USTEC)
Trend :
Recommendation :
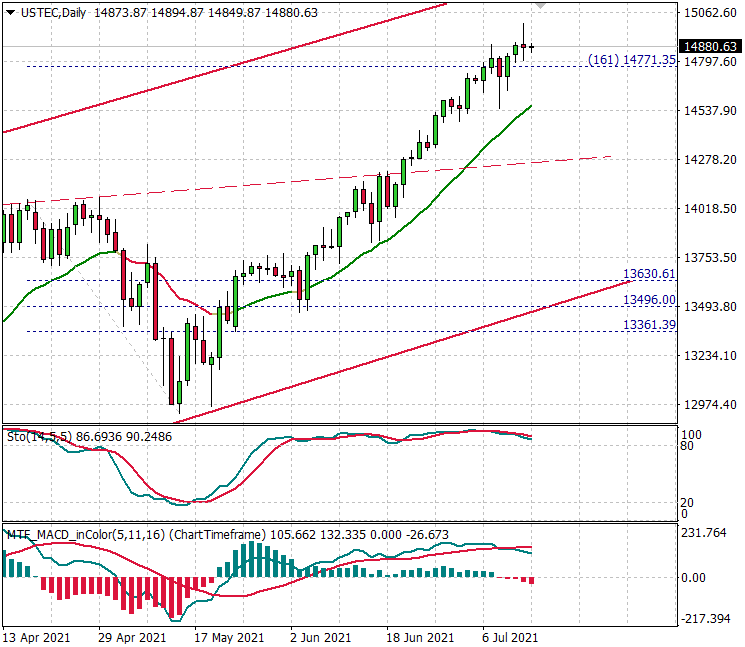
Last : 14,880
Target price :
Protective stop:
Outlook
Price reached a high at 15,002 last night, closing the day with a Spinning Top candlestick pattern. This index has been rising along with the rising 20EMA, but the sizes of the candles are relatively small. The 20EMA will be acting as support at 14,560. Stochastic is currently in the overbought region. MACD is still bullish but has been given divergence warning.
Trading Idea
Wait for better trading idea.
S&P 500 Index
(CFD Symbol: US500)
Trend:
Recommendation:
Last: 4365
Target price:
Protective stop:
Outlook
Price broke out from the Triangle chart pattern on 25 June. It rebounded after being support by the upper edge of the cloud support, coinciding with the 20EMA. A Bearish Engulfing candlestick pattern was formed last night after reaching a high at 4392. A possible correction towards the 20EMA at 4315 if price cannot break through the high. Stochastic is falling now. MACD remains bullish but has given divergence warning.
Trading Idea
Buy 4315 for 4390 with a stop below 4285
