
Market News
- U.S. stocks ended down slightly on Tuesday, with investors selling tech-related growth shares after U.S. Treasury yields hit a 14-month high. Dow Jones fell 104 points, S&P 500 was down 12 points and Nasdaq Composite slid 14 points.
- President Joe Biden on Wednesday will unveil more details about the first stage of his infrastructure plan, which could be worth as much as $4 trillion, after earlier this week saying 90% of adult Americans would be eligible for vaccination by April 19.
- Investors will watch closely monthly U.S. non-farm payrolls data on Friday, with Federal Reserve policymakers so far citing slack in the jobs market for their continued lower-for-longer stance on interest rates, which has boosted the growth outlook but also stoked worries about inflation.
Market Views
- Shares in Asia-Pacific traded lower on Wednesday morning as investors waited for the release of Chinese economic data. Hang Seng index fell 87 points and Nikkei 225 index plunged 237 points.
- Oil prices rose on Wednesday, paring overnight losses a day ahead of a meeting of OPEC and its allies, with investors betting the producers will largely agree to extend their supply curbs into May as OPEC+ is going to show supply discipline.
Dow Jones Index
(CFD Symbol: US30)
Trend :
Recommendation :
Last : 33,053
Target price:
Protective stop:
Outlook
Price tested its previous price resistance high of 33,229 for the past two occasions but still could not break through. It has to penetrate above this resistance for more upside at 33,610. The 20EMA is still rising, hinting at the bullish price trend now. Stochastic has a bullish crossover now. MACD is also strong and bullish now but could form a potential divergence warning.
Trading Idea
Wait for better trading idea

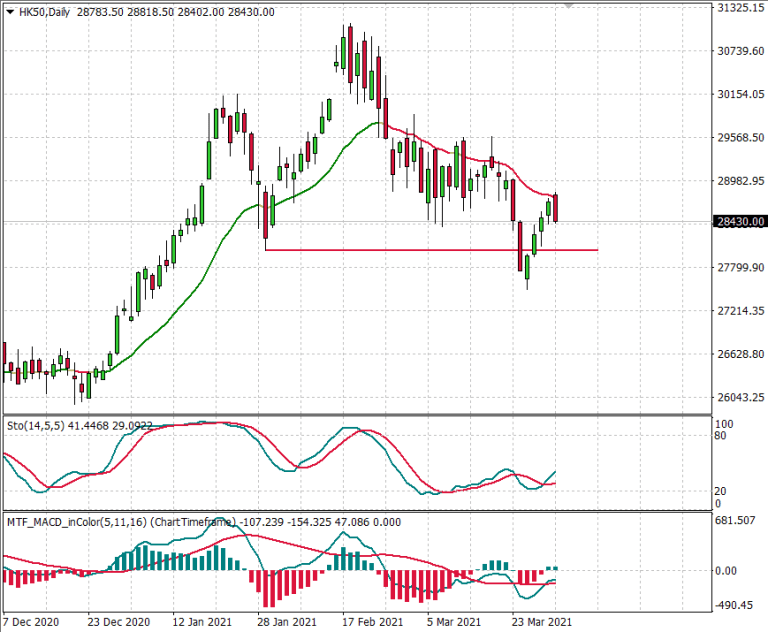
Hang Seng Index
(CFD Symbol: HK50)
Trend :
Recommendation :
Last : 28,430
Target price:
Protective stop:
Outlook
Price hit the 20EMA resistance today after the four consecutive days’ rally. The 20EMA is still falling, hinting at the bearish trend. A Bearish Engulfing reversal candlestick pattern could be in the formation, and we could expect price to continue its downward movement to test its low at 27,500 again. Stochastic is still weak now. MACD is also bearish.
Trading Idea
Sell 28,800 for 27,700 with a stop above 29,200
Nasdaq 100 Index
(CFD Symbol: USTEC)
Trend :
Recommendation :
Last : 12,902
Target price :
Protective stop:
Outlook
This index is likely to continue ranging from 12,730-13,340 until either end is violated. A violation of the lower end of the boundary at 12,730 on a closing basis would likely bring price lower towards its previous low at 12,210. Stochastic is still strong and a bullish crossover is likely. MACD is bearish now but both of its lines are moving higher
Trading Idea
Buy 12,700 for 12.950 with a stop below 12,550.

S&P 500 Index
(CFD Symbol: US500)
Trend:
Recommendation:
Last: 3958
Target price:
Protective stop:
Outlook
Price is going to test its previous price resistance high at 3988. The 20EMA is acting as support at 3926. There is potential divergence warning given from the MACD. If price cannot surpass 3988, we are likely to see a possible correction. Stochastic just had a bullish crossover. MACD is still bullish now but it is weak.
Trading Idea
Wait for better trading idea
