
Market News
- S&P 500 fell for a fifth straight day on Wednesday but the decline was slower than past few days. The session was volatile as investors reacted to headlines about coronavirus and sought to gauge its economic fallout. The Dow slipped 123 points while Nasdaq Composite was up 15 points.
- President Trump, in a scheduled news conference on the coronavirus accused cable TV news channels of presenting the danger from the coronavirus in as bad a light as possible and upsetting financial markets.
- There are now more new virus cases being reported outside China. Brazil reported its first infection overnight and U.S. health authorities have said a global pandemic is likely.
Market Views
- Stocks in Asia Pacific continued to fall on Thursday morning trade session, struggling to find a footing as the rapid global spread of the coronavirus left investors on edge and seeking safety in gold and bonds. Hang Seng index fell 203 points and Nikkei 225 index slid 401 points.
- U.S. consumer confidence dropped slightly last week as fears over the coronavirus spread and began to push down stock prices, according to Morning Consult’s Index of Consumer Sentiment.
Dow Jones Index
(CFD Symbol: US30)
Trend :
Recommendation :
Last : 26,614
Target price:
Protective stop:
Outlook
Six days of consecutive decline have sent this index below the bullish trend channel, the two resistance-turned-support levels at 28,160 and 27,320 and the 20EMA to a low of 26,588. The next support lies at 26,460 and 25,740. The trend is bearish with no reversal in sight at the moment. Stochastic is heading lower and is near to the oversold region. MACD is still bullish but the slow line is approaching the zero line.
Trading Idea
Wait for better trading idea

Hang Seng Index
(CFD Symbol: HK50)
Trend :
Recommendation :
Last : 26,509
Target price:
Protective stop:
Outlook
This index was capped by the Fibonacci 62% correction point and broken below the falling 20EMA, the gap support zone and closed below the channel. As long as the gap resistance zone from 27,169 to 27,264 is not completely filled, we could see more possible downside to the previous low of 26,000. Stochastic is moving lower. MACD is bearish and just had a bearish crossover.
Trading Idea
Sell at 26,750 for 25,600 with stop at 27,300

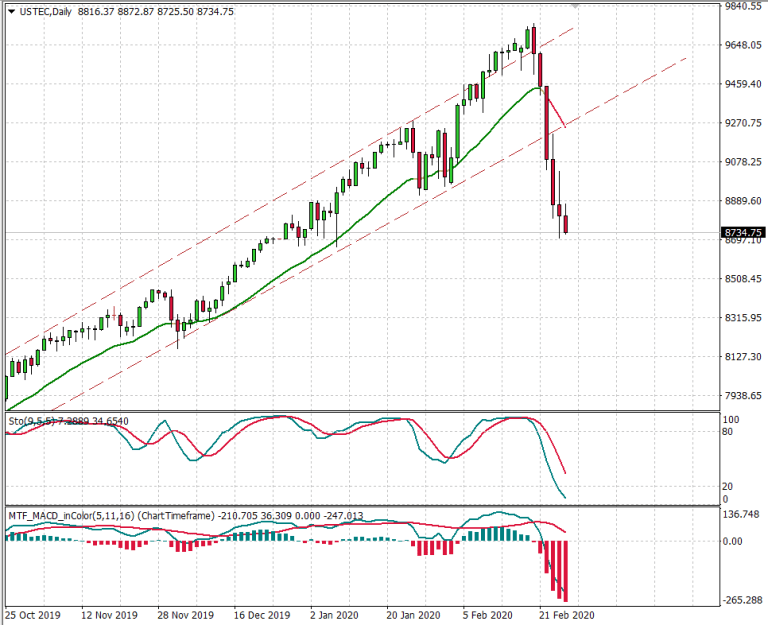
Nasdaq 100 Index
(CFD Symbol: USTec)
Trend :
Recommendation :
Last : 8734
Target price :
Protective stop:
Outlook
The index created a bearish Engulfing candlestick pattern on Jan 20 followed by a Three Black Crows candlestick pattern followed a few days later, which are both trend reversal patterns. It has moved below the 20EMA and the bullish trend channel. We could see price moving lower towards 8660 and if this level cannot hold, the next support lies at 8450. Stochastic is turning down but MACD is still bullish at the moment.
Trading Idea
Wait for better trading Idea
S&P 500 Index
(CFD Symbol: US500)
Trend :
Recommendation :
Last : 3076
Target price:
Protective stop :
Outlook
The index created a bearish Engulfing candlestick pattern and has moved below the falling 20EMA and also its previous low at 3213. It is now testing the lower support at 3060-3070 and if this level is unable to halt the decline, we may see this index moving lower towards 2855. Stochastic is moving lower and near to the oversold region. MACD is still should be turning bearish within the next couple of days
Trading Idea
Wait for better trading idea
